
What are All-in-one index funds
Your bank is probably evil and so is mine. Any of the big banks in Canada (and even the smaller ones) push their own mutual funds on financially ignorant individuals and get them to pay exorbitant fees that are up to 1000% higher (over 10 times) then index funds and offer little to no benefits. I compared mutual fund fees to index alternatives in Mutual Funds vs Index Funds, this article picks up where that leaves off.
Mutual Funds and Index Funds
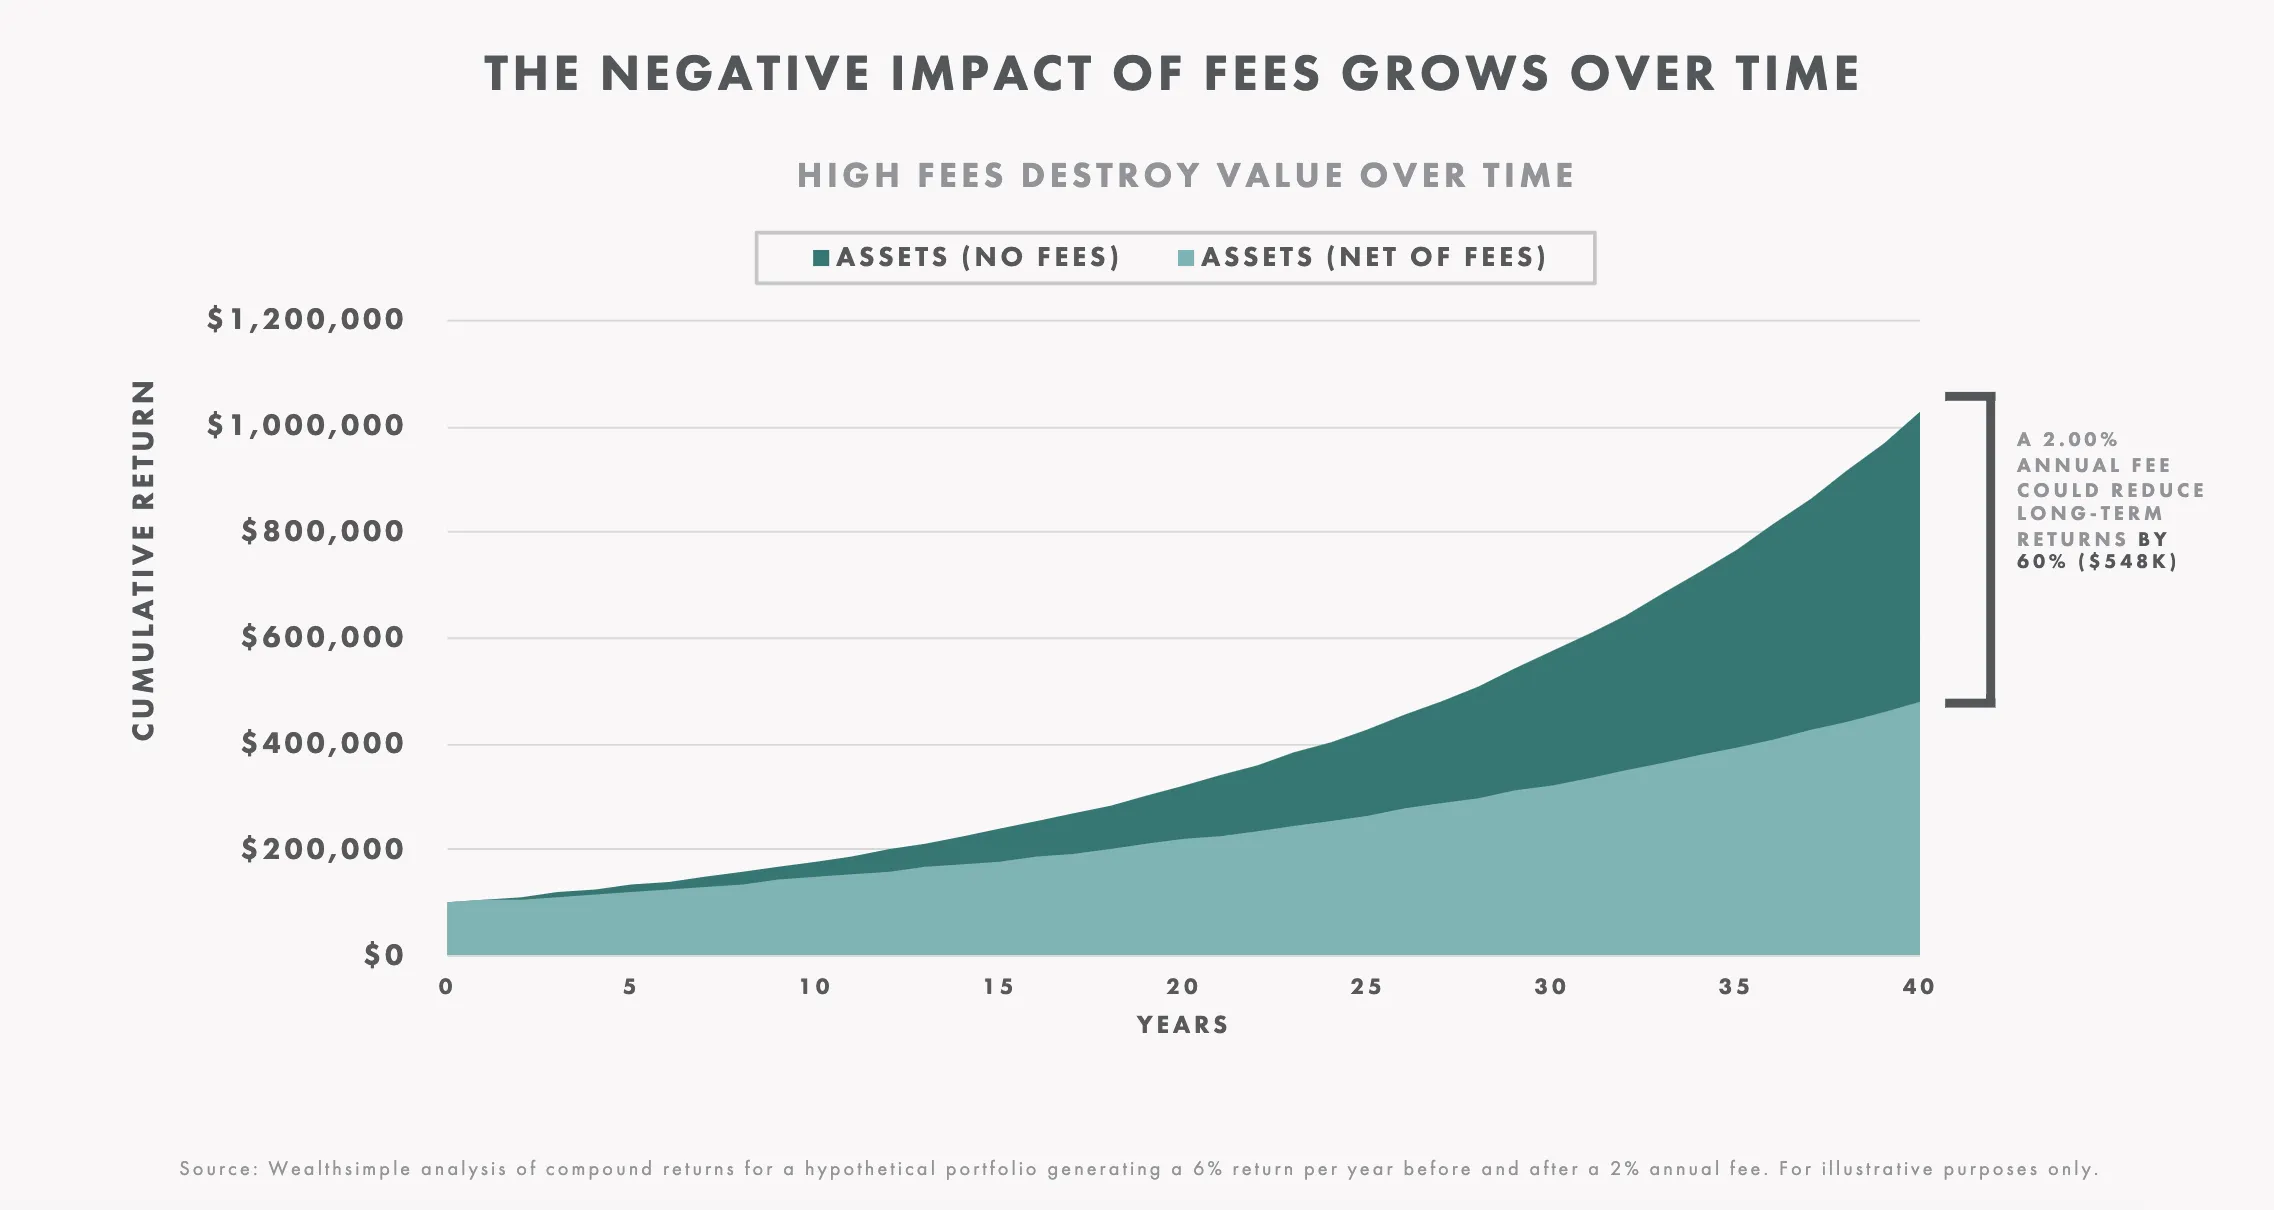
Source: Wealthsimple. Index funds and mutual funds both try and offer you an easy way to get a diversified portfolio but while index funds offer management fees ~0.25%, mutual funds often charge between 1-3%. The reason that banks will tell you for their fee is because they will “beat the market” but that statement is simply untrue in almost all cases and in the long term the vast majority of banks are not worth the high fees they charge.
All-in-one Index Funds
If there was a downside to index funds it would be that there are many to pick from and it can be intimidating, enter “All-in-one” (AIO) index funds! The goal of this product is to keep the the fees low but be a one stop shop, and there are options for pretty much anyone.
There are many AIO options but we will be looking at the 3 most common situations:
- 10+ year horizon: 100% equity (VEQT, XEQT, HGRO)
- 5+ year horizon: 80/20 growth (VGRO, XGRO, ZGRO)
- 3+ year horizon: 60/40 balanced or conservative (VBAL, XBAL, VCNS)
I want to be honest: the time horizon framing is an oversimplification and I think it does people a disservice. A product like VGRO is 80% VEQT with bonds mixed in. Same equities, same composition, same underlying risk. The bonds smooth out the ride but they also drag down returns. You are not reducing risk in any objective sense. You are obfuscating the volatility of equities by blending them with bonds.
Lower volatility does not mean lower risk. If you are investing for 30 years but cannot stomach seeing your portfolio drop 30% in a bad year, then yes, something like VGRO might help you stay in your seat. The best return is the one you can actually hold through a downturn without panic selling. But if you have a 5 year horizon and are genuinely comfortable with volatility, there is a real argument for 100% equity over a balanced fund. You would expect higher returns in exchange for a bumpier ride.
Time horizon should not be the only input to this decision. Risk tolerance, income stability, and whether you actually need this money on a specific date all matter. Someone saving for a house down payment in 3 years has a very different calculus than someone building a TFSA they won’t touch for decades.
If you want to see the actual cost of picking a lower-expected-return product over a higher one, run both scenarios through the ETF Growth Calculator and compare the difference at your time horizon. The gap is often surprisingly large.
All of these products range from 0.2-0.4% management fee (referred to as MER) and while there are differences like some are more weighted to US companies, some are more Canadian companies, some are more international, etc. they are all probably better in the long run then any actively managed fund that your bank will offer you. Use the Portfolio Fee Audit to see how your bank’s MER compares.
Composition breakdown
Here’s a more detailed look at the composition of the major all-in-one options:
100% Equity (most aggressive)
| Ticker | Provider | MER | Canada | US | Int’l | Emerging |
|---|---|---|---|---|---|---|
| VEQT | Vanguard | 0.24% | ~30% | ~43% | ~20% | ~7% |
| XEQT | iShares | 0.20% | ~25% | ~45% | ~22% | ~8% |
| HGRO | Horizons | 0.17% | ~30% | ~42% | ~21% | ~7% |
80/20 Growth
| Ticker | Provider | MER | Equities | Bonds |
|---|---|---|---|---|
| VGRO | Vanguard | 0.24% | ~80% | ~20% |
| XGRO | iShares | 0.20% | ~80% | ~20% |
| ZGRO | BMO | 0.20% | ~80% | ~20% |
60/40 Balanced
| Ticker | Provider | MER | Equities | Bonds |
|---|---|---|---|---|
| VBAL | Vanguard | 0.24% | ~60% | ~40% |
| XBAL | iShares | 0.20% | ~60% | ~40% |
| ZBAL | BMO | 0.20% | ~60% | ~40% |
40/60 Conservative
| Ticker | Provider | MER | Equities | Bonds |
|---|---|---|---|---|
| VCNS | Vanguard | 0.24% | ~40% | ~60% |
| XCNS | iShares | 0.20% | ~40% | ~60% |
Within each risk category, the products from different providers are functionally interchangeable. Pick the risk level that matches your time horizon and comfort with volatility, pick a provider, and move on. If you’re stuck between VEQT and XEQT specifically, I wrote a deep dive comparing them. Ready to open an account and buy one? Self-directed investing in 5 steps walks through setup. Later, Reduce fees on index funds shows how to buy the underlying ETFs and cut MER further.
Factor-tilted alternatives (2026 update)
In early 2026, CIBC partnered with Avantis to launch Canadian-listed factor-tilted ETFs. The flagship is CAGE (Avantis CIBC All-Equity Asset Allocation ETF) which is similar to VEQT/XEQT but adds systematic tilts toward value, smaller companies, and profitability based on academic research (the Fama-French five-factor model). It trades on the TSX at a 0.28% management fee and holds ~45% US, ~32% Canadian, ~15% international developed, and ~8% emerging markets. For more on the factor approach, see PWL Capital’s five-factor paper or Ben Felix’s video on the Avantis launch.
Note: This article was originally written in 2021. The composition tables and factor-tilted alternatives section were added in July 2026 to reflect new products and updated MERs. The core advice hasn’t changed: any of these products will serve you well.